


The Technical Intrinsic Value Model in Action: Autodesk ($ADSK)
How two perfectly timed entries turned $20,000 into $152,000 – and why this isn't luck, but method.


When Price Meets Pattern: The Case of Autodesk
In a market driven by noise, narratives, and quarterly surprises, I've always believed there’s something deeper beneath the surface — a rhythm, a structure. And for over 15 years, my answer to this hidden order has been the Technical Intrinsic Value (TIV) model.
Let me take you through the case of Autodesk ($ADSK) — a textbook example of how Technical Intrinsic Value reveals long-term opportunities that others simply cannot see.

The First Signal: July 2009
The world was still shaken from the 2008 financial crisis. Fundamentals were broken, sentiment was crushed, and most investors were on the sidelines.
But in July 2009, Autodesk was trading at $22.30. My model calculated a Technical Intrinsic Value of $21.71. This 97% alignment between market price and technical value is rare — typically occurring once or twice per year per stock.
While others saw a declining software company, my model identified the end of a long accumulation phase. The cycle structure signaled a multi-year expansion ahead.
I would have entered at $22.30. The rest, as they say, is mathematics.
What Is the Technical Intrinsic Value Model?
Most valuation methods are backward-looking — built on discounted cash flows, earnings multiples, and quarterly revisions.
The TIV model is different. It doesn't try to determine what a company is worth in business terms. It determines what the market will eventually price it at, based on:
Long-term price structures
Market cycles
Mathematical symmetry across historical patterns
Think of it this way:
Fundamental Intrinsic Value = What the company is worth to an accountant
Technical Intrinsic Value = What the market will eventually decide it's worth
And when the two converge? That’s when opportunity becomes undeniable.
Why Autodesk?
Autodesk isn’t just another tech company. It dominates the CAD software space. Engineers, architects, and designers across the globe rely on its tools daily.
Business Highlights:
Over 5 million professional users
90%+ gross margins
25%+ free cash flow margins
Irreplaceable software embedded in global infrastructure
Predictable subscription-based revenue
But here's the key: these fundamentals were not the reason I entered. They were the reason my technical thesis had staying power.
Strong businesses tend to fulfill strong technical patterns.
15 Years, 2 Entries
Entry #1: Post-Crisis Clarity (2009)
Market Price: $22.30
TIV Value: $21.71
Result: Price rose to ~$350 over the following decade
Return: +1,246% (10k → $134,600)


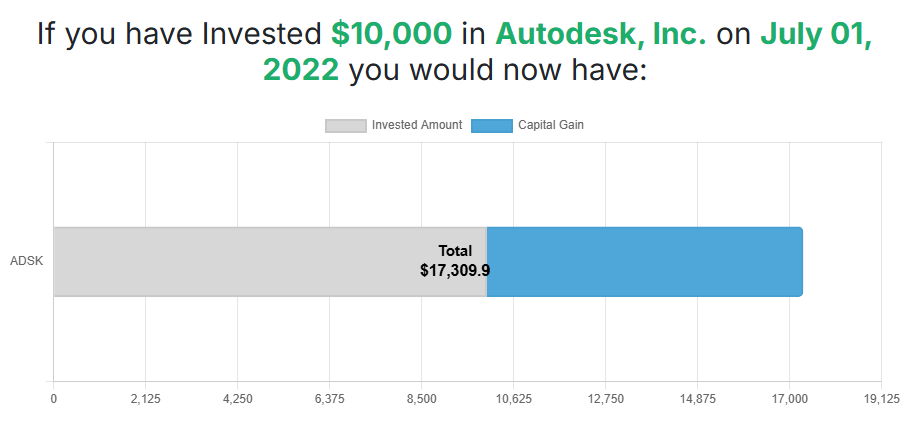
Entry #2: Tech Selloff Precision (2022)
In mid-2022, tech was in freefall. $ADSK had dropped from $340 to $171. Panic set in.
My model recalculated. The updated Technical Intrinsic Value? $171.96. The exact market price on July 1st, 2022.
I would have entered a new position.
Market Price: $171.96
Current Price: ~$300
Return: +74% (10k → $17,400)


Where Are We Now?
My current Technical Intrinsic Value projection for Autodesk is $456.30.
Current Market Price: ~$300
Upside Remaining: ~50%
We are currently in Wave 5 of the broader TIV cycle — historically the last phase of the cycle.
I would hold until TIV and market price converge. At $456.30, the cycle completes. No guesswork. No emotion. Just discipline.
Why Other Methods Missed It
Fundamental Analysts: Focused on DCF revisions, ignoring the technical structure.
Technical Traders: Bought breakouts, got stopped out on corrections.
Momentum Players: Entered too late, exited too soon.
Buy-and-Hold Crowd: Earned decent returns, but missed optimal entries and exits.
TIV Investors: Waited for structural convergence. Acted only twice in 15 years. Captured full-cycle upside.
The Philosophy Behind the Model
TIV isn’t about short-term trades. It’s about recognizing when:
Structure aligns with valuation
Market cycles are near completion
Price and pattern meet in mathematical harmony
And most importantly: knowing when to do nothing.
Final Thoughts
Two trades. Fifteen years. $20,000 became $152,000.
Not because of luck. Not because of timing earnings. But because of a disciplined model based on market structure and technical precision.
If you're tired of the noise — and ready to invest based on cycle structure, not headlines — I invite you to explore the TIV methodology.
Wishing you profitable decisions,
The Symphony of Stock Picking
Nicolau Primavera Carvalho
Interested in learning how to calculate Technical Intrinsic Value yourself?
👉 Become a Founder Member and master the model
Disclaimer: This is not financial advice. Past performance does not guarantee future results. Always do your own research before investing.